Sport, data, ideas

Category: rugby

6 Nations finale: saving the tries to last

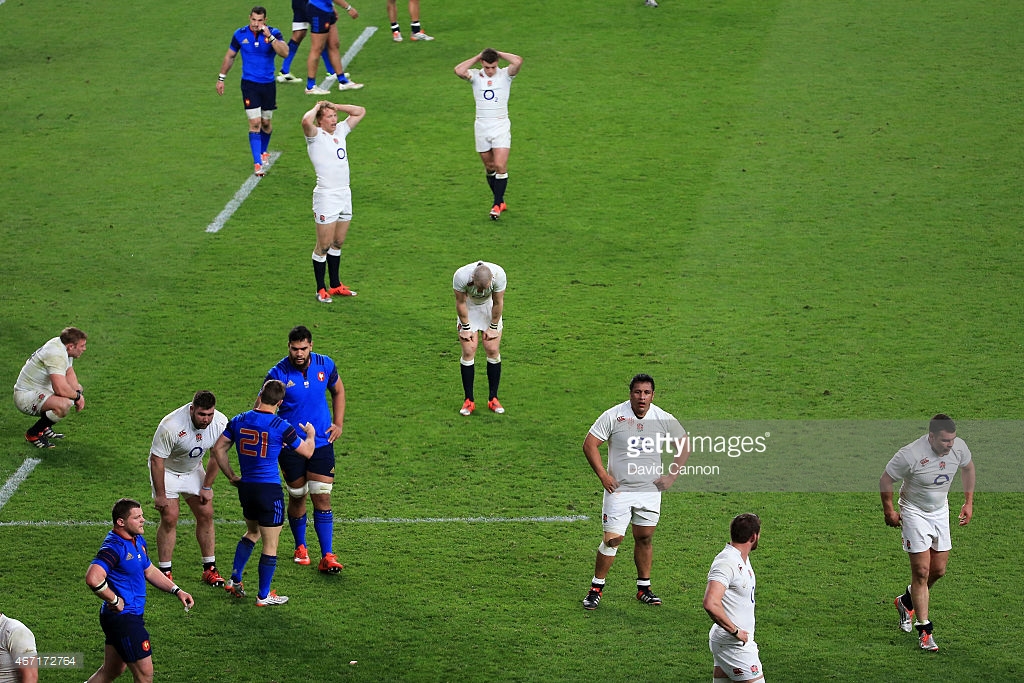
467172764I’m still reeling from the 6 Nations final weekend. I was lucky enough to be at Twickenham, and rugby matches like that are remarkable. But the stats from the weekend are remarkable too.

For starters, the England-France match equalled the highest total number of tries in a 6N match (12) and was the second highest points total with 90. The only match that surpasses it in points (and equals it in tries) is the England-Italy match from 2001, but that was an 81-23 thrashing, mid-tournament.

Part of the reason it the last day was so dramatic was how each team in the previous match had set the bar higher. Wales did their best with eight tries vs Italy; Ireland scored 40 points against Scotland, winning by 30. And so the England-France match was set up perfectly, and it delivered right to the last moment.

And while the numbers can’t convey the excitement, they do back up idea that it was the most dramatic finish ever.

In total, 27 tries were scored on the last day of the 2015 6N. That’s 44 per cent of the tries scored in the whole competition. Compare that to 2012, when just four tries were scored on the last day.

The only other years that come close are 2005, 2007 and 2014, which also saw 20 or more tries on the last day (also all above 30 per cent of the total tries).

6N tries and last round

In those years, the outcome of the tournament was also in the balance on the final weekend. Wales won in 2005, securing the Grand Slam, although France had racked up seven tries against Italy to keep their title hopes alive. In 2007, France scored a last-minute try to take the title over Ireland by just 4 points. And in 2014, Ireland’s narrow 2-point victory over France (again with last-minute drama) gave them the title on points difference over England.

Recent advocates of changing the scoring system to include bonus points might be right in the long run, but with the last two competitions being decided right at the last, it might be a while before anyone signs up to a new set of rules.

The 6 Nations is getting less exciting – according to the scores

A slightly worrisome chart on the BBC this week in the run up to the opening 6 Nations match between England and Wales. It showed the average points difference for each match since 2000, with a big uptick at the end. Higher points difference means one-sided matches, surely? And that isn’t good for nail-biting matches, and crowd entertainment.

Here’s that BBC chart:

But does that tell the whole story? Perhaps not.

Points difference is only one aspect of a game. An open game which ends 40-30 is clearly more exiting than one that ended 15-5. The same ten-point difference doesn’t convey the excitement in the first game.

Clearly total points is also important. But total points alone clearly doesn’t tell the whole story either. 57-3 is hardly as exciting than 33-27.

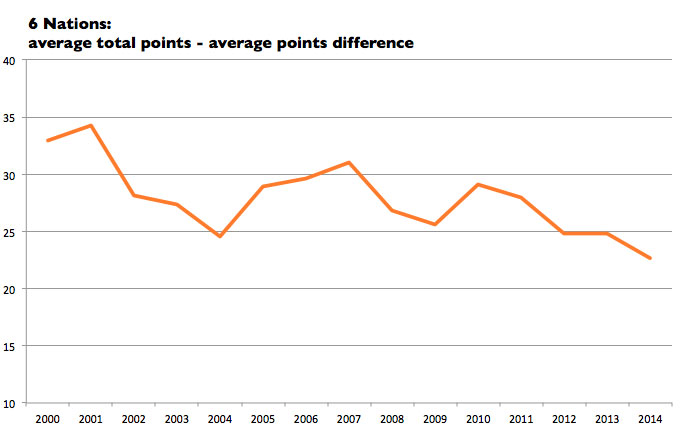
So ideally, we want high-scoring games with a small points difference. If we take the average total points per game and subtract the points difference, that gives us some idea of excitement, at least from the scoreline. It means a 23-20 game is more exciting than 6-3, as it would score 40 (23+20-3) points compared to 6 (6+3-3).

6Nations-TP-DP

So what does the chart show? The total points scored minus the difference in points (TP-DP) is dropping over the years, and is now at just 22.7 from being over 30 in the first years of the 6 Nations. There was an initial decline, and then with breakdown rule changes, excitement increases to 2007; but then the decline starts again. We want the line on the chart to be trending up, not down.

That’s not good. But what about the Italy effect? Italy, when they were introduced to the 6 Nations, took a few big losses as the team became used to the standard of competition. They lost 80-23 to England in 2001. The 12 times that a team has lost by 40 points or more in the 6 Nations, Italy have been the loser eight times, and most of those were pre-2006.

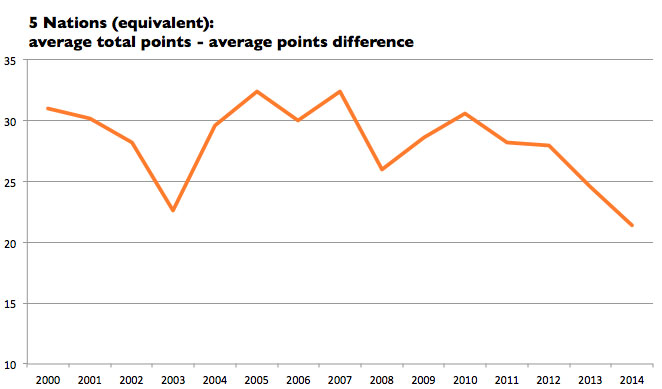
So let’s take Italy out of the equation. Of the old 5 Nations teams, has it got more or less exciting?

5Nations-TP-DP

It’s the same pattern, only more pronounced. There is a sharp decline to 2003; an increase to 2007; and then a drop from 2010.

The worrying thing is that we are at a low: it’s 21.4, when several years had TP-DP scores of over 30.

Time for further rule changes? Who knows? Scores only tell you so much: a low-scoring match with a sudden try at the end can still be a gripping game. But then, scores on average will tell us something. If they are anything to go by, the 6 Nations is getting one-sided, and, I hate to say it, a bit dull.

© 2024 Rob Minto

Theme by Anders NorenUp ↑