Rob Minto

Sport, data, ideas

Category: Sportonomics (page 1 of 10)

Sport and statistics

Why Alastair Cook’s record is no big deal

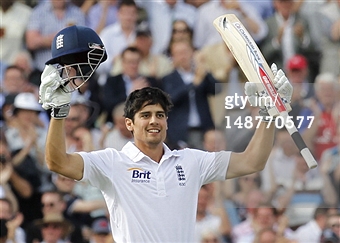
In all the celebration of Alastair Cook becoming England’s most prolific scorer of centuries, one thing occurs. Despite all the “how far could he go” conjecture, it’s just not that a big deal.

Yes, he’s a very very good batsman. But without wanting to kill the party dead, just look at the overall list. There is only one of the big test playing nations which has a lower all-time century scorer: New Zealand. Need I go on?

OK, put it another way. Cook’s 23 tons puts him equal fourth on the India list, and joint seventh on the all time Australia list for century scorers.

Is the list skewed by more test cricket in recent decades? Not really. Cook would also be 4th on the West Indies list, behind Viv Richards and Gary Sobers, as well as Brian Lara.

If Cook was from Pakistan? Third on the list. South Africa? Third. Sri Lanka? Without wanting to get repetitive – third. So of all the big test nations, bar New Zealand, he wouldn’t even be in second place.

In essence, the England centuries record of 22 was always there for the taking. The fact that it had stood for so long was a strange anomaly, and could easily become a fluid thing for a while with Petersen only one ton behind.

Cook is terrific, on a great run of form, and will be a run machine all-time great. But this isn’t the record to get that excited about. Table below the break…

Continue reading

Djokovic vs Federer vs chance: is the draw fixed?

On Friday, Roger Federer and Novak Djokovic line up in the semi-final at Wimbledon. Although they have never played each other on grass before, a semi-final meeting has a very familiar ring to it.

Well, that’s because it is familiar – and a bit too frequent, when you look at the odds.

In fact, since Djokovic broke into the top 4, it is amazing how many times he and Federer have been placed in the same half of the draw. For those unfamiliar with how it should work, here it is:

  • The number 1 and 2 seeds are placed at opposite ends of the draw. Then, the 3rd and 4th seeds are picked at random and placed in one half or the other, away from the top 2 seeds so that they can only meet at the semi-final stage.
  • For many years, Federer was #1 in the world, with Nadal #2 and Djokovic #3 or #4. Now, Djokovic is #1, with Federer #3. Never in a slam have Federer and Djokovic been 1 and 2 seeds.

So, to recap: for since half way through 2007, for each of the four slams in a year, it has been a 50:50 chance that Federer and Djokovic should end up in the same half of the draw.

In fact, since Djokovic has broken into the top 4, (which has coincided with an ever-present Federer in the top 3), they have been in the same half of a grand slam draw 16 times out of 21.

To get 16 heads flipping a coin 21 times is not good odds. For what should be a 50 per cent chance, it is running at over 76 per cent. That looks suspicious.

And in 2009 and 2011, they were in the same half for EVERY slam. That’s a 1 in 16 chance for the year, repeated.

Overall, unless my statistics is letting me down, the chance of 16 out of 21 coin tosses coming up heads is 0.0097 – that’s the binomial probability. Here’s the calculator I used – enter 0.5, 21 and 16 to see the results. That’s not very likely.

[Aside: They are such good players, that out of the 16 times they have been in the top 4 seedings and drawn in the same half, they have managed to get to play each other 9 times, with one or both players going out before the semi stage 7 times.]

Why would you want to play Federer and Djokovic in the same half? To get Nadal in the final, that would be one possibility, to try and engineer more Nadal-Federer finals. Or, more likely, it’s just chance. But a few more Federer-Djokovic semis, and perhaps the players should be hiring statisticians as well as dieticians.

Here’s the data in a Google spreadsheet.

What if cricket counted centuries differently?

Alistair Cook’s 294 against India got me thinking today – why does 200 not count for 2 in the 100s column in a batsman’s career stats? And if it did? How would the stats look then?

Going from 99 to 100 may just be one run, but it’s the milestone. So why not 199 to 200? It’s the same achievement, 100 consecutive runs in one innings. So the chart below shows how the century list would look if scores over 200 counted as 2 centuries, over 300 as 3, and Lara’s 400 as 4.

In this chart, the accepted number of centuries is in orange, and the compound counting of 200s, 300s and 400 is in blue.

The first thing you notice is that although Tendulkar is still in top spot, his lead is cut, and he hasn’t got too many “big” scores compared to others.

Second – the big beneficiaries are Lara, who leapfrogs Ponting, and Bradman, who gets a huge boost. Sehwag and Hammond also move ahead of rivals, as do Sangakkara and Jayawardene.

Here’s the best list for data: Cricinfo – double hundreds, triple hundreds. And here’s my big100s spreadsheet.

As ever, it just confirms that Bradman is the best of all time. But it also would reward the effort of getting from 100 to 200. Time to change the counting system, I think.

The perils of comparing the greatest at different sports

It could almost be a sport itself – debating who is the greatest sportsman of their sport / generation / all time. The great names are easy to think of – Pele, Federer, Bradman, Woods. Or is it Maradona, Laver, Tendulkar, Nicklaus?

The arguments will rumble on, but a few statistical caveats should always be kept in mind. One is: You can’t compare between sports very easily.

Here’s an example which has made me furious. In a recent issue of Prospect magazine, Jay Elwes tries to make the case for Indian cricketer Sachin Tendulkar being the best sportsman in the world. Fair enough, a good candidate I’d agree. But just read the following paragraph:

At which point, a question arises: can Federer, perhaps the greatest ever tennis player, be measured alongside Tendulkar? One instructive comparison is the distance by which each leads the trailing pack. Federer has won 16 Grand Slam tennis titles. In second place is Pete Sampras on 14, which makes Federer 14 per cent more successful than his nearest competitor. Tendulkar has scored a total of 32,803 runs for India in Test and one-day internationals combined. Ponting, in second place, has scored 25,769, meaning that Tendulkar has scored 27.3 per cent more again than his nearest rival. His lead is nearly twice that of Federer.

I’d like to say this is a small blip, but it’s not. It seems to be the main data to buttress his argument. What’s wrong with this? In no particular order:

  • Why are total runs so important? Tendulkar is great, but he’s played more matches than anyone else too in both tests and one-day internationals.
  • How on earth can you make sense of a “percentage lead” when the range is 0 to 16? And compare it to a measurement system with range 0 to 30,000 plus? Idiotic.
  • If Federer wins the US Open next month, that puts him 21 per cent more successful than Sampras, up from 14 per cent. And the point is?
  • Comparing grand slams to runs is just bonkers. You accumulate runs, win or lose. You can’t do that with grand slams.
  • Why not compare total tennis match victories to runs? Or test match wins to tournament wins? It would be a more like-for-like comparison, although similarly meaningless.

I could go on, but you get the idea.

Cricket and tennis lend themselves to some fascinating statistical analyses. But this is not an “instructive comparison”. It’s grossly misleading, shows little thought, and does the debate about great sportsman no favours. Prospect magazine is a superb publication, but this is not one of their better articles.

The limits of sports stats: the example of Nadal and the WSJ

This year in tennis is been all Djokovic and that winning streak. The narrative of sports is always about who is “the Man”, so therefore, Rafael Nadal must be a spent force.

The Wall St Journal have, they think, proved it. In their piece Nadal Looks Surprisingly Human in Paris they look at the stats of Nadal’s first four matches this year, and compare to the years he has won before.

Nadal’s stats don’t reflect a full-blown disaster. But compared to his first four victories in the years he won here, Nadal is spending on average a half hour longer on court and breaking opponents’ serves far less often. All this despite not playing a single seeded opponent so far.

What’s wrong with this? First off, players who are seeded CAN’T meet another seed until the third round anyway, so that’s hardly stunning. Let’s look a bit more at the stats they cite.

Serve Game WIN% RETURN GAME WIN% GAMES WIN% SET
WIN%
AVG. MATCH LENGTH
2011 85.5% 39.7% 62.8% 85.7% 2:52
2010 85.2% 50.9% 68.2% 100% 2:18
2008 87.8% 65.2% 76.8% 100% 2:05
2007 86.8% 50.9% 68.9% 100% 2:14
2006 81.8% 43.9% 62.9% 85.7% 3:04
2005 87.7% 44.6% 66.4% 92.3% 2:09

Sources: ATP World Tour, Stats Inc.

His average match length is high, but it was higher in 2006 when he won the title – hardly shocking. The only 2011 stat quoted which is worst in the list is the percentage of return games won – 4 per cent lower than the next lowest. Four per cent, which works out at about 2.5 games on the opponent’s serve that he hasn’t won in 4 rounds – less than a break of serve less per match.

So we have boiled Nadal’s struggle down to about a break less per match from 2006, perhaps two per match from his peak, plus a bit more time on court.

It’s hardly evidence of decline. But stats are like that. They don’t always show what seems evident to watchers and commentators. They don’t show the workrate, the struggle on points, the extra deuces, the attitude. Perhaps those things are there, perhaps we’re seeing what we want to see to fit the narrative. Let’s see what happens from here to the final.

The FA cup: magic and economics

There are three things always said about the FA Cup. It’s the world’s oldest cup competition; it has a magic to it; and it isn’t what it once was. But few people actually manage to quantify how or why the cup’s importance is in decline.

The Guardian’s secret footballer promised to do so, citing Freakonomics as an inspiration, but then trotted non-economic analysis such as how the timing of the final (amongst normal Premiership games) and other factors such as Manchester United pulling out for the World Team Cup in 2002 had undermined it. There’s also the argument that the prestige of playing at Wembley is devalued by holding Cup semis there.

All true, but not really the point. Then, tucked away towards the end of the piece, the Secret Footballer hit the nail on the head:

Stoke City or Manchester City will pick up £1.8m for winning the FA Cup, which is the difference between finishing 15th and 17th in the Premier League.

And then in the next paragraph: “£30m is on offer to reach the Champions League [for finishing in the top four]”.

It’s a trophy, but not one financially worth winning if you take your eye off Europe or the league.

In a world where football is ALL about money, that tells you everything you need to know.

Where is the Marathon’s Usain Bolt?

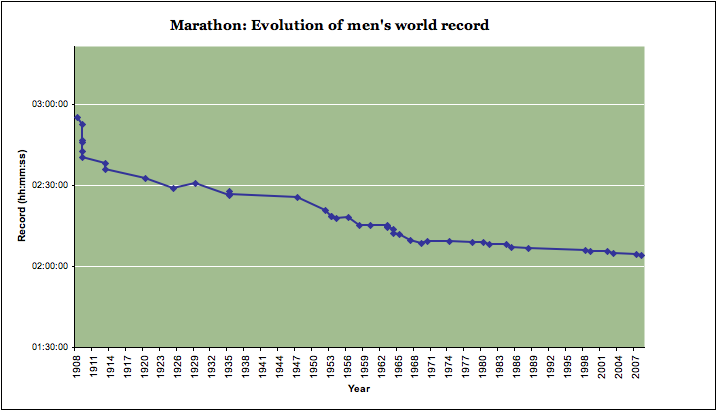
Today is the London Marathon. Aside from the amazing efforts of people to raise money for charity, and the tremendous physical effort to complete the course, we are unlikely to see a world record today. Why? With all the improvements in diet, technology and sports science, why aren’t we running sub-2 hour marathons?

This is a question the BBC tried to answer recently, and they did quite a good job, looking at the kinds of issues and conditions marathon runners face.

The marathon record progression is starting to look like a classic long-tail chart. Here it is:

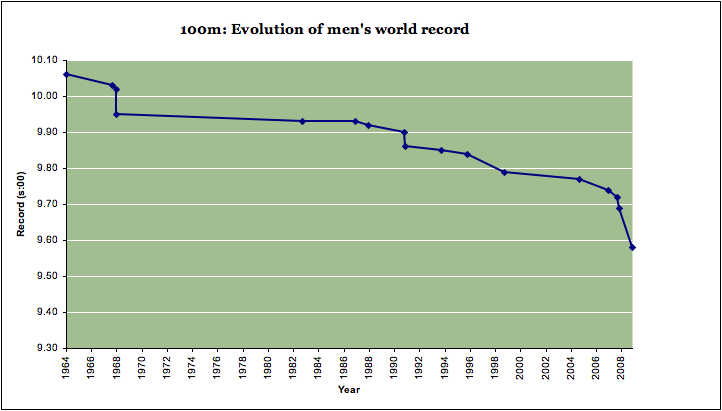
One thing they could have done was compare it to the men’s 100m, which was also looking like it had stalled, until Usain Bolt came along:

So could someone do to the marathon what Usain Bolt did to the 100m record?

Given that the marathon IS so long, you would think there was more room for cutting swathes of time off the record, and that the 100m would be the small, incremental progression – and yet it hasn’t happened like that.

Perhaps this is because the optimal physical build of the marathon runner has been worked out for a long time now, whereas Bolt flew in the face of 100m conventional wisdom with his physique. You aren’t going to get a complete turnaround in marathon runners, as the distance is too long.

So have we reached the end of marathon records? Will 2 hours ever be beaten? I think it will, but not in 20 years as the BBC article suggested, but either very soon or not for 50 years. Records rarely stick to the charts.

Ponting’s captaincy

Just a quick post to say that in all the statistics mentioned around Ricky Ponting’s time as captain of Australia’s cricket team, the most telling was this, made by Mike Selvey in the Guardian:

[Steve] Waugh, during 57 Tests in his five years as captain, introduced just six debutants to the side, and one of those was the greatest wicketkeeper-batsman who ever lived. Ponting has been in charge for 78 matches and in that time 32 players have made their debut.

Djokovic and the multiple slam winners [UPDATED]

With Novak Djokovic winning in Australia, most of the coverage has focused on Andy Murray coming up short in his 3rd slam final (a damning stat – 3 finals, 0 sets won).

I thought I would concentrate on Djokovic instead. Djokovic has now won 2 of his 4 slam finals, which is not bad in the scheme of things. Amongst current players, only Federer (16-6), Nadal (9-2) and Del Potro (1-0) are in better shape. Hewitt is the same (2-2), there’s Ferrero on 1-1, while Roddick (1-4) had the misfortune of coming up against Federer in his prime 4 times.

For Murray, the only other multiple slam loser currently is Soderling with 0-2. The 1-time finalists I won’t list here.

However – one facet of Djokovic’s win is that it moves him from the one-time winner list to multiple winners, and does the Australian Open a favour at the same time.

The mark of a great player is winning more than one slam, ideally at more than one venue. Single slam winners are one-offs. They devalue the currency of the slam win, and don’t foster the key element to tennis’ popularity – rivalries. Continue reading

The Ashes in stats

I was going to do this for this blog, but then got asked to do it for the FT. Here it is (registered).

The best nuggets include:

Australia lost by an innings in three out of the five matches in the series. Before that, they had lost by an innings in just three Tests in 242 Test matches since 1990. They won by an innings in 36 matches in that period, winning 144 times overall.

Nine 100s scored by English batsmen; three by Australian batsmen. On the 2006-07 Ashes tour, England scored three to Australia’s nine.

Other stats are even more painful – England took 30 more wickets overall – 86 to 56. In stats, whichever way you look at it, it was a very one-sided series. Strange that after 3 matches, it was 1-1.

Older posts

© 2024 Rob Minto

Theme by Anders NorenUp ↑