I always enjoy the Forbes Sports Rich list. It formed the basis for a chapter in my book, and tells you a lot about sport once you dig into the figures.
For instance, looking at this year’s list, here are a few observations.
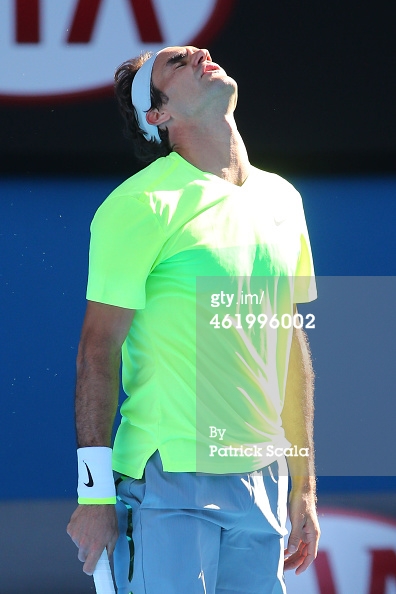
- Roger Federer is a sponsorship machine. $65m in endorsements puts him $13m higher than LeBron James in second place.
- American football players don’t get marketing dollars. The highest-sponsored is Drew Brees, and he’s on $13m in endorsements, which is less than his salary.
- Boxer Floyd Mayweather still rakes it in – his $275m in pay is three times more than any one else. It pays to punch, with Conor McGregor fourth in the overall list.
- Basketball pays overall – 40 of the top 100 represent that sport.
- There are zero women on the list. That’s not good. In previous years, at least a few female tennis players made it. We seem to be regressing, either in who we value in terms of marketing or how we pay sports stars.
The most interesting way of ordering the list, in my view, is by the ratio of endorsements to pay.
This naturally shows up individual sports where some players have had poor seasons but are trading on reputation – Tiger Woods, Novak Djokovic. There are sports people where the sport pays (relatively) poorly, but profile is high – Usain Bolt, Virat Kohli.
But it also shows how some stars are not making the most of their winning seasons. For instance, golfer Justin Thomas won $21m in prize money, but netted just $5m in sponsorship. Surely he’s going up? And if Lewis Hamilton can get $9m in sponsorship, how is Sebastian Vettel getting only $300k? They get the same pay, according to Forbes.
Here’s my Endorsements / Salary list – for those where Endorsements are higher than Salary.
| Overall Rank | Name | Pay $m | Salary/Winnings $m | Endorsements $m | Sport | E/S |
| 16 | Tiger Woods | 43.3 | 1.3 | 42 | Golf | 32.3 |
| 45 | Usain Bolt | 31 | 1 | 30 | Track | 30.0 |
| 35 | Kei Nishikori | 34.6 | 1.6 | 33 | Tennis | 20.6 |
| 86 | Novak Djokovic | 23.5 | 1.5 | 22 | Tennis | 14.7 |
| 26 | Rory McIlroy | 37.7 | 3.7 | 34 | Golf | 9.2 |
| 22 | Phil Mickelson | 41.3 | 4.3 | 37 | Golf | 8.6 |
| 7 | Roger Federer | 77.2 | 12.2 | 65 | Tennis | 5.3 |
| 83 | Virat Kohli | 24 | 4 | 20 | Cricket | 5.0 |
| 23 | Jordan Spieth | 41.2 | 11.2 | 30 | Golf | 2.7 |
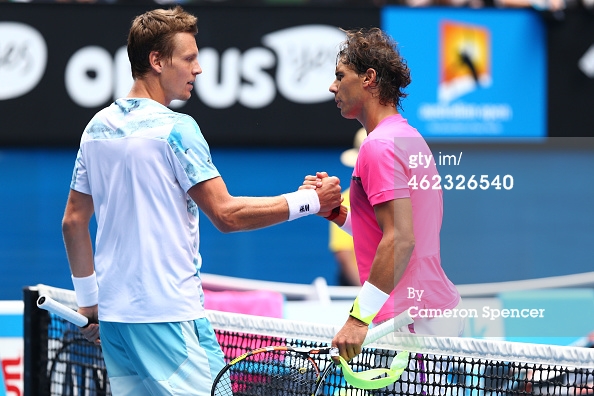
| 20 | Rafael Nadal | 41.4 | 14.4 | 27 | Tennis | 1.9 |
| 6 | LeBron James | 85.5 | 33.5 | 52 | Basketball | 1.6 |
| 11 | Kevin Durant | 57.3 | 25.3 | 32 | Basketball | 1.3 |
| 8 | Stephen Curry | 76.9 | 34.9 | 42 | Basketball | 1.2 |
And here’s the sports list.
| Basketball | 40 |
| American Football | 18 |
| Baseball | 14 |
| Soccer | 9 |
| Golf | 5 |
| Boxing | 4 |
| Tennis | 4 |
| Auto Racing | 3 |
| Cricket | 1 |
| Mixed Martial Arts | 1 |
| Track | 1 |
Lastly, here’s the forbes rich sports list as an Excel file.
 The Sumo Matchup Centuries In The Making
 Premier League 2015-16 – the story of the season
 A visual history of women’s tennis
 A Visual History of Which Countries Have Dominated the Summer Olympics