Sport, data, ideas

Category: Sportonomics (Page 3 of 10)

Sport and statistics

The voice of “home-bred” sport

Hugh McIlvanney writes in today’s Sunday Times:

Year by year, almost day by day, it becomes more difficult to talk of Premier League clubs’ involvement in the Champions League as an English challenge. The term will be even less likely to trip off the tongue if David Dein’s association with a Russian steel magnate, Alisher Usmanov, ultimately puts Arsenal at the mercy of another foreign takeover. Of our big European contenders this season, Liverpool and Manchester United are owned by Americans and Chelsea are, of course, already Russian-ruled.

Now it seems that Arsenal may establish an east-west balance of power. None of the four has an English manager and only a small percentage of their players are home-bred. All this may not mean much to most people but it happens to sadden me.

It might sadden Hugh, but it’s hardly realistic. Once the major clubs listed on the stock exchange, they were always liable to any investor from any country taking them over. To suggest that they should remain in British hands with British managers is to misunderstand the point of the market. That’s the deal – you raise capital through selling shares, you can’t decide who buys them. Does Hugh mind that the Sunday Times is owned by an Australian? Why should having British players be so important?

The only argument I can see is that is depletes the pool of players for the England team, as there are fewer opportunities at the top domestic level. But this is not an argument that bears scrutiny. All is suggests is that English players don’t “travel well” and play for clubs abroad. Which is true, but not universal – two recent examples of Beckham and Heargreaves have played for foreign clubs while maintaining a England place.

Also, you want English players to play with the best from other countries, to familiarise themselves with techniques, to de-mistify, and to challenge. The influx of foreign players has coincided with a so-called golden generation – a crop of English players that are superb. They just don’t perform well for England.

To compare with other structures, lots of companies are staffed by people not “home-bred” (isn’t everyone bred at home?). Banks are full of people from all over the world. My department at work has employees from France, Australia, China and Switzerland. To suggest a football club should operate on a different basis is narrow-minded at best, jingoistic at worst. Many journalists and commentators try to remind us that football is all about the fans. If the fans are happy to consume the product, whether the players were raised in Africa, Europe or elsewhere, why should we care? Plus it extends the marketing of the Premiership abroad, generating more revenue for the game. Unless we don’t want fans from abroad – wouldn’t that be saddening…?
Wimbledon’s key numbers

Federer for five in a row? Too obvious. Women to get equal prize money? Interesting, but too late. (I’ve dealt with that before – they shouldn’t, but it’s complicated).

The numbers the Guardian is interested in is still a perennial. Where does all the money go?

David Conn looks at the some of the numbers, and there’s an underlying discontent in the fact that debentures fund the championships’ redevelopment of courts and so on. Referring to debenture seats, he notes:

A total of 2,300 were sold, raising £46m and occupying 16% of the seats, with a further 8% reserved for corporate hospitality packages. Ritchie defends the championships from accusations of exclusivity…

I presume his argument is that “real” fans don’t buy debentures. Nothing could be further from the truth. Many debenture tickets are owned by real fans. Just not all, and it upsets many debenture holders when the corporate non-fans ruin it for everyone else.

Anyway, those numbers in the Guardian:

£25,544,765
Surplus made by Wimbledon in 2006

£11,282,710
Total prize money this year

3,100,000
People expected to play tennis at least once this year

500,000
People expected to keep playing regularly

£23,150
Cost of a Centre Court debenture for one seat for 2006-2010

18,000
Tennis courts in the UK, mostly ‘in a state of disrepair’, according to the LTA’s own report

If this seems so bad, think about the number of people who join a gym and then stop going. And the amount of money in football academies.

A little perspective on tennis is needed. Better public courts are needed, but it’s a cultural shift that is required as much as the money. Tennis is not seen as a sport to get out of poverty, like it is in some European countries, and was for the Williams sisters. It’s still a middle-class hobby in the UK, so the urgency just isn’t there. The numbers quoted by the Guardian only tell half the story.

Henry on his way

As Arsenal have sold Thierry Henry, many papers mention his scoring record of 226 goals in 369 matches for the club, including 42 in 84 in Europe. His style of play gets the headlines, but his scoring rate is hugely impressive – he also has 40 goals for France in 92 matches. These stack up against any comparitive player you choose. For example, Alan Shearer scored more Premiership goals (260), but in more matches (441) – a rate of 0.58 compared to Henry’s 174 in 254 – 0.68 goals per game.

Henry cost £10.5m from Juventus in 1999, and is being sold at 29 for £16m – an impressive return. Arsene Wenger has a knack of pulling off brilliant deals. Nicolas Anelka cost £0.5m in 1996, and was sold 3 years later to Real Madrid for £22.3m.

Whatever happens, the stats show that Henry is a great player who will be missed, but Wenger is a shrewd manager who knows a good bit of business when he sees it.

Clocking up the miles with Beckham and the Ren sisters

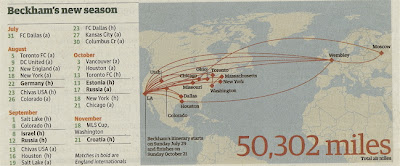
(c) The Guardain. Click for full size image.

David Beckham looks likely to pull off the strange feat of playing for LA Galaxy AND England. If so, his itinerary next season is pretty full, and involves a lot of flying. The guardian did a nice graphic to show this alongside a story that Alexi Lalas of LA Galaxy would “drive him to the airport”. Here it is.

50,302 miles. Sounds a lot, right? That’s some carbon footprint right there. But then another story caught my eye. Another sport, different situation, but the Ren sisters may well be the next big thing in tennis, if their potential is fulfilled. In this interesting piece in the Telegraph that compares them to the Williams sisters, it states that “the girls require 30,000 miles of chauffeuring each year just to get to training and tournaments”.

Beckham – 50,000 miles.
Two girls on the junior tennis circuit – 30,000 miles. And you can bet that it’s not first class travel plus entourage.

England and the Champions League

The Guardian picked up on an interesting data story yesterday, highlighting the research by the financial advisors Grant Thornton that only 16 English players have appeared in the Champions League final in its 15 year history. Not enough, you might think, but then only 3 English clubs have got to the final (ManU 1999, Liverpool 2005, 2007, Arsenal 2006). What this research really points out is that English players don’t “travel”. Very few of our top players move to clubs abroad, and Premiership clubs are cash-rich so can import players from all over the world.

If you look at the French team, almost all of their players are in foreign leagues. However, in the last World Cup, Italy had a squad 100% based in their domestic league. Even England had Beckham (Real Madrid) and Hargreaves (Bayern Munich) playing abroad. And Italian clubs and players have dominated the Champions League

Here’s the table:

Top ten countries who have supplied the most players in Champions League finals No. of finalists % of overall total Population
1: Italy 90 21.95% 58.15m
2: Spain 56 13.66% 40.45m
3= France 41 10% 63.71m
3= Germany 41 10% 82.4m
5: Holland 36 8.78% 16.57m
6: Brazil 24 5.85% 190.01m
7: England 16 3.90% 50.43m
8= Portugal 15 3.66% 10.64m
8= Argentina 15 3.66% 40.30m
10: Croatia 9 2.20% 4.49m

Source: Grant Thornton, CIA World Factbook

Lesson: buy Italian players. Or an Italian club.

FinkTank

I’ve run a bit of number crunching on that Time Fink Tank piece. You can read it here.

Interestingly, one comment made on the Times website points out exactly one of the anomalies highlighted by my work.

Have the authors checked whether the scores for all the team members together are consistent with the team’s position in the league? For example, Bolton were seventh in the league but their top two players are ranked 64th and 134th. That doesn’t sound like it tallies to me. Something like that might give a cross check to the validity of the approach.

Keith, Dubai

Exactly.

Fink again

The Fink Tank sounds awful, but actually it’s an interesting idea. You can see the results in the Times, which proclaim: “Daniel Finkelstein has ranked every Premiership player using a mathematical and statistical model to end all the debate”<br />
<br />
Well, I don’t think it ends the debate, but we’ll come to that later.<br />
<br />
The model works by identifying “the relationship between goals scored and every kick of the ball made by every player for every club”. I presume this takes into account defending as well as attacking. But it mention tackles, pressure that indirectly relates to goals, or other parts of football. A more detailed methodology is needed.<br />
<br />
It penalises players for lack of time on the pitch – which is strange, as some players are used deliberately as a “super-sub” or impact player, and their lack of pitch-time is a virtue.<br />
<br />
Here is the methodology:<br />
<br />
The Fink Tank Predictor provides forecasts and ranking systems for English and European club football, based on a statistical model of matches based on more than five years of football scores.<br />
<br />
In looking at player rankings for this season, the phrase �time-adjusted points� means the number of points the player would have added to an average team in the full season, compared with an average replacement. The points are then adjusted to reflect the amount of time spent on the pitch � minimum 400 minutes. <br />
<br />
OK, so what do we get? Christiano Ronaldo is by far and away the best player, with 19.12 points, ahead of Frank Lampard on 16.24. Ronaldo was acclaimed for his performances this season, Lampard was not. Strange, but there you go.<br />
<br />
There are 3 goalkeepers in the top 10. This is strange, as the methodology suggests that the Fink Tank is the relationship between goals and every kick of the ball. Were their long-ball goalkicks often converted into goals? Or do saves count? They certainly haven’t been scoring, or putting in crosses like a winger.<br />
<br />
To see if the Fink Tank points reveal anything strange, I have analysed each team’s points, and averaged it per player – some teams had only 18 players, others had 24, so points per player seems fairest. I then related this points per player average to the Premiership table, to see how it related to final standings, points, goals scored and goal difference. Given that FinkTank points are given for influence in goals, you would expect some correlation with the goals scored column.<br />
<br />
And what did we get? Well, <a href=”https://minto.net/blogs/uploads/finktank.xls” title=”finktank.xls” target=”_blank”>the results are in this spreadsheet</a>. To break it out:<br />
<br />
<table cellpadding=2 border=0><tr> <td style=”border:1px solid;”>Club</td><td style=”border:1px solid;”>position</td><td style=”border:1px solid;”>Points</td><td style=”border:1px solid;”>Goals</td><td style=”border:1px solid;”>Goal diff</td><td style=”border:1px solid;”>total Fink points</td><td style=”border:1px solid;”>Players</td><td style=”border:1px solid;”>points per player</td></tr><tr><td>Manchester United</td><td>1</td><td>89</td><td>83</td><td>56</td><td>99.94</td><td>20</td><td>4.997</td></tr> <tr><td>Arsenal</td><td>4</td><td>68</td><td>63</td><td>28</td><td>98.89</td><td>20</td><td>4.945</td></tr> <tr><td>Chelsea</td><td>2</td><td>83</td><td>64</td><td>40</td><td>82.4</td><td>21</td><td>3.924</td></tr> <tr><td>Liverpool</td><td>3</td><td>68</td><td>57</td><td>30</td><td>50.36</td><td>21</td><td>2.398</td></tr> <tr><td>Tottenham Hotspur</td><td>5</td><td>60</td><td>57</td><td>3</td><td>35.02</td><td>21</td><td>1.668</td></tr> <tr><td>Portsmouth</td><td>9</td><td>54</td><td>45</td><td>3</td><td>3.36</td><td>20</td><td>0.168</td></tr> <tr><td>Blackburn Rovers</td><td>10</td><td>52</td><td>52</td><td>-2</td><td>-0.75</td><td>20</td><td>-0.038</td></tr> <tr><td>Everton</td><td>6</td><td>58</td><td>52</td><td>16</td><td>-5.52</td><td>19</td><td>-0.291</td></tr> <tr><td>Middlesbrough</td><td>12</td><td>46</td><td>44</td><td>-5</td><td>-5.31</td><td>18</td><td>-0.295</td></tr> <tr><td>Newcastle United</td><td>13</td><td>43</td><td>38</td><td>-9</td><td>-12.36</td><td>21</td><td>-0.589</td></tr> <tr><td>Aston Villa</td><td>11</td><td>50</td><td>43</td><td>2</td><td>-16.03</td><td>22</td><td>-0.729</td></tr> <tr><td>Reading</td><td>8</td><td>55</td><td>52</td><td>5</td><td>-24.04</td><td>20</td><td>-1.202</td></tr> <tr><td>Charlton Athletic</td><td>19</td><td>34</td><td>34</td><td>-26</td><td>-27.19</td><td>22</td><td>-1.236</td></tr> <tr><td>West Ham United</td><td>15</td><td>41</td><td>35</td><td>-24</td><td>-29.87</td><td>24</td><td>-1.245</td></tr> <tr><td>Manchester City</td><td>14</td><td>42</td><td>29</td><td>-15</td><td>-32.7</td><td>24</td><td>-1.363</td></tr> <tr><td>Sheffield United</td><td>18</td><td>38</td><td>32</td><td>-23</td><td>-42.58</td><td>22</td><td>-1.935</td></tr> <tr><td>Fulham</td><td>16</td><td>39</td><td>38</td><td>-22</td><td>-41.83</td><td>20</td><td>-2.092</td></tr> <tr><td>Wigan Athletic</td><td>17</td><td>38</td><td>37</td><td>-22</td><td>-61.48</td><td>21</td><td>-2.928</td></tr> <tr><td>Bolton Wanderers</td><td>7</td><td>56</td><td>47</td><td>-5</td><td>-72.26</td><td>18</td><td>-4.014</td></tr> <tr><td>Watford</td><td>20</td><td>28</td><td> 29</td><td>-30</td><td>-95.9</td><td>20</td><td>-4.795</td></tr></table><br />
<em><br />
Source: Times newspapers, Premier League</em><br />
<br />
What looks weird here? Well, what the hell are Bolton doing near the bottom? Their goals scored is good, goal difference ok, points and position put them at 7th – yet their FinkTank points put them at next to last by some distance.<br />
<br />
Bolton are the biggest anomaly, but there are others. Arsenal have a lot of FinkTank points, but seem to be underperforming in the league. the Fink Tank puts them second to ManU and a long way ahead of Chelsea.<br />
<br />
I don’t want to comment too much on individual players, but it seems very odd that Paul Robinson is ranked 402 – and that Hleb of Arsenal is in the top 10. I have also looked at the top goal scorers and their Fink Tank points, and the correlation is poor – only 0.41.<br />
<br />
Teams however, seem to come out roughly correct. The correlation between FinkTank points per player per club and the 4 rankings in the Premiership table are good:<br />
<br />
Correlation of points scored in Premiership to Finktank points per player per club <strong>0.852</strong><br />
<br />
Correlation of Premiership table position to Finktank points per player per club <strong>-0.785</strong><br />
<br />
Correlation of goal difference to Finktank points per player per club <strong>0.870</strong><br />
<br />
Correlation of goals scored to Finktank points per player per club <strong>0.838</strong><br />
<br />
Correlation of Premiership points to position (for reference) <strong>-0.954</strong><br />
<br />
These are all strong correlations. We should expect to see table position to be a weaker correlation as the gap between teams is not shown in position on a list, and this is true. The Premiership points scored is a better guide. <br />
<br />
Also, goal difference is closer to FinkTank points than goals scored – perhaps the methodology looks at negative play as well as positive.<br />
<br />
Overall, the Fink Tank is a good predictor of how a season pans out. What it can’t do is explain Bolton. Or, more pertinently, it seems to ignore the effectiveness that Bolton have as a team. It also inflates the position of Arsenal. Is this because Arsenal’s build-up play is more intricate than other clubs, and Bolton play more route-one football? If the methodology of the Fink Tank was more open and detailed, perhaps these perceived truths could be proved one way or other once and for all. <br />
<br />
Here are the charts to show the relationships in the table above.<br />
<br />
<div class=”serendipity_imageComment_left” style=”width: 772px”><div class=”serendipity_imageComment_img”><!– s9ymdb:8 –><img width=’772′ height=’571′ src=”https://minto.net/blogs/uploads/Fink_postition.gif” alt=”” /></div><div class=”serendipity_imageComment_txt”>The Premiership clubs ranked by FinkTank points per player for the 2006-7 season</div></div><br />
<br />
<div class=”serendipity_imageComment_left” style=”width: 685px”><div class=”serendipity_imageComment_img”><!– s9ymdb:4 –><img width=’685′ height=’411′ src=”https://minto.net/blogs/uploads/Fink_chart1.gif” alt=”” /></div><div class=”serendipity_imageComment_txt”>This table shows the final standings in the 2006-7 Premiership season for each club and their Fink Tank points per player.</div></div><br />
<br />
<div class=”serendipity_imageComment_left” style=”width: 685px”><div class=”serendipity_imageComment_img”><!– s9ymdb:5 –><img width=’685′ height=’435′ src=”https://minto.net/blogs/uploads/Fink_chart2.gif” alt=”” /></div><div class=”serendipity_imageComment_txt”>This table shows the goals scored by each club in the 2006-7 Premiership season and their Fink Tank points per player.</div></div><br />
<br />
<div class=”serendipity_imageComment_left” style=”width: 685px”><div class=”serendipity_imageComment_img”><!– s9ymdb:6 –><img width=’685′ height=’398′ src=”https://minto.net/blogs/uploads/Fink_chart3.gif” alt=”” /></div><div class=”serendipity_imageComment_txt”>This table shows the final points for each club in the 2006-7 Premiership season and their Fink Tank points per player. </div></div><br />
<br />
<div class=”serendipity_imageComment_left” style=”width: 685px”><div class=”serendipity_imageComment_img”><!– s9ymdb:7 –><img width=’685′ height=’407′ src=”https://minto.net/blogs/uploads/Fink_chart4.gif” alt=”” /></div><div class=”serendipity_imageComment_txt”>This table shows the goal difference for each club in the 2006-7 Premiership season and their Fink Tank points per player. </div></div><br />
<br />

Serbian tennis – the new BIG thing

So. You look at the French Open draw, and think – aside from Federer-Nadal, where are the other contenders coming from? Answer: Serbia.

The semis draw is:
Roger Federer SUI (1)
vs
Nikolay Davydenko RUS (4)

Novak Djokovic SRB (6)
vs
Rafael Nadal ESP (2)

and in the women:

Justine Henin BEL (1)
vs
Jelena Jankovic SRB (4)

Ana Ivanovic SRB (7)
vs.
Maria Sharapova RUS (2)

Let’s be honest – no-one is seriously considering an all-Serbian trophy haul, or anything other than a Fed-Nad final. But it’s interesting how some countries catch the tennis vibe, and people talk of a wave of players. Not long ago it was the Spanish men. Then the Russian women. I’m going to take a closer look at some of the data on this, but my instinct is that there is no formula as such. It’s a mixture of training partners coming to the boil at the same time, supporting each other, and a whole lot of luck.

Fink big

Move over Opta. The Times yesterday launched Fink Tank, their unique rankings of football players in the Premiership. A heaven of statisics, I’m going to take a closer look later. First, a few observations:

1) Introducing the rankings with the line: “How did Fink Tank do it? We used a multivariate Poisson log-normal model. I hope you find that information helpful.” was pretty off-putting. Only real serious mathmaticians care about running several Poisson distributions as a method of removing anomalies – if that’s what it is…

2) The model works by identifying “the relationship between goals scored and every kick of the ball made by every player for every club”. I presume this takes into account defending as well as attacking. But it mention tackles, pressure that indirectly relates to goals, or other parts of football. A more detailed methodology is needed.

3) It penalises players for lack of time on the pitch – which is strange, as some players are used deliberately as a “super-sub” or impact player, and their lack of pitch-time is a virtue.

Here is the methodology:

The Fink Tank Predictor provides forecasts and ranking systems for English and European club football, based on a statistical model of matches based on more than five years of football scores.

In looking at player rankings for this season, the phrase “time-adjusted points” means the number of points the player would have added to an average team in the full season, compared with an average replacement. The points are then adjusted to reflect the amount of time spent on the pitch – minimum 400 minutes.

I’ll take a closer look in my longer, research blog later. Time to crunch a few numbers…

Big wins, big losses, big deal

Again, much is being made of the England win over the West Indies – England’s 3rd biggest win, the Windies biggest ever loss. I feel alone in thinking – so what? It’s a exceptionally poor Windies team, so it’s hardly earth-shattering news. I prefered the record that it was the coldest temperature ever recorded at a test – 7 degress C. Welcome to England in May.

Many papers prefer to focus on the fact that Michael Vaughan has equalled Peter May’s record for most test wins as England captain – in 7 fewer tests too. It’s a good record to be sure, but paltry compared to other countries – he’s still a long way behind Steve Waugh’s 41 wins or Clive Lloyds 36.

« Older posts Newer posts »

© 2024 Rob Minto

Theme by Anders NorenUp ↑