Rob Minto

Sport, data, ideas

Page 19 of 39

Secret winning formula: high fives

Apparently giving high fives makes you a winning team! High Five!

You don’t have to be sport’s answer to Ben Goldacre to realise that it might be something to do with winning in the first place that makes people high five, rather than the other way about.

Next:

  • Why fist-pumps make you a tennis champion
  • Why a propensity to stand on podiums and spray people with Champagne makes you a winning race driver
  • Gatorade: tip it over your manager for best results
  • Why that weird running-hands-together-and-dive-on-the-pitch celebration will win you football silverware

The gender timebomb of India and China: a stab at the numbers

When I visited India in 2003, I was shocked by areas of the countryside where there seemed to be not a young girl in sight. It was all boys, as far as you could see.

When we asked our tour guide about the lack of girls, he scoffed at any suggestion of infanticide or selective abortion. Instead, he told us that women could conceive a boy if they slept on a particular side of their body just after intercourse.

This was a man with a degree, a full education and seemingly worldly-wise. He surely couldn’t believe the old-wives tosh, and was just peddling nonsense to avoid reality.

But the population time-bomb in India and China is soon going to be upon us. China pursued a one-child policy that has skewed a generation towards males. India’s gender imbalance is cultural rather than state-imposed, but has a similar effect.

Take India. If the 917 girls to 1000 boys ratio is correct, that means by 2020, we are looking at over 25m (and probably closer to 35m) shortfall in girls to boys in a 15 year generation.

The back-of-envelope maths:
There are 100m plus children aged 0-4. Multiply by 3 for a 15-year generation. 300m * (1-0.914) = 25.4m

In other words, there are going to be, in all likelihood, over 20m young men in India who have no chance of finding a partner.

In China, it’s around the same scale – over 20m young men left out of the dating game. The population data used in the CIA Factbook bears this out:

0-14 years Male Female Difference
India 187,450,635 165,415,758 22,034,877
China 126,634,384 108,463,142 18,171,242

In a generation, we are going to have over 40 million enforced bachelors in India and China. What does this mean for these societies? There are several trends we can expect, as outlined in Bare Branches:

high male-to-female ratios often trigger domestic and international violence. Most violent crime is committed by young unmarried males who lack stable social bonds. Although there is not always a direct cause-and-effect relationship, these surplus men often play a crucial role in making violence prevalent within society. Governments sometimes respond to this problem by enlisting young surplus males in military campaigns and high-risk public works projects. Countries with high male-to-female ratios also tend to develop authoritarian political systems.

In other words:
– rising crime in sex trafficking and prostitution
– social bonds weaken
– riots and disillusionment
– authoritarian crackdown
– high military enrollment

Not a wildly happy future. All those who see India and China as a one-way bet should perhaps think again.

Further reading:

BBC:India’s unwanted girls
Economist: The worldwide war on baby girls
Economist: China’s population – The most surprising demographic crisis
UNFPA: Sex-Ratio Imbalance in Asia: Trends, Consequences and Policy Responses

UPDATE: The economist has a great chart on China’s population and the impact of the one-child policy.

The crazy world of Wimbledon’s prize money

In a good but not great Wimbledon final, Novak Dkokovic beat Rafael Nadal today. I was supporting Nadal (actually I am quite a big Nadal fan). So I did what you might call an “emotional hedge” and put a bet on Djokovic to win.

Some people see this as heresy. I’m not sure why. For no moment did I stop supporting Nadal. But after the match had finished, I thought – hey ho, cheer up, you made a few bob.

So my mood was altered. Here’s the e-ticket from BlueSquare:

Selection 1 Novak Djokovic @ 5/4 To Win – Win
Market Match Winner
Event Wimbledon
Rafael Nadal v Novak Djokovic
14:05 03/07/2011
Bet Type Single
Unit Stake £40.00
Returns £90.00

Very nice. Not bad odds either, for a 2-horse race, where the outsider had only lost one match all year. So a £50 return improved my mood. Not a fortune, but a decent sum for a small wager.

And then I thought – what about Nadal? Is he happy? I doubt it. He has lost the title, and the number one ranking to Djokovic. I’m sure he’s not having a crisis, but he certainly won’t be happy. Yet he’s just earned £550,000 today as runner up.

That’s 11 thousand times my winnings today. He’s definitely not 11,000 times happier than me, that’s for sure. Yes, it’s all relative. But I think Nadal would be unhappy today if he got £2 million of even £20 million. His game is now measured in titles, not money. He’s already earned over $41m in prize money alone, let alone sponsorship, so he’s set for life.

Which leads me to two thoughts. Money doesn’t make us happy – we all knew that really, so let’s move on to… why are sportspeople paid so much? And so much more than inflation? Nadal as runner up has just won more money than Lleyton Hewitt did in 2002 – less than 10 years ago. (Hewitt got £525,000 for winning, Djokovic just got £1.1m today).

Wimbledon has increased prize money this year by 10 per cent for most stages of the tournament (including winner and runner up), and by 8.5 per cent overall. This is much higher than inflation. Why do they need to do it?

Is there a prize money race with other events? Does prize money equal prestige? Hardly. Other tournaments offer a lot, but you would have thought the grand slams – which have a joint committee – would conspire not to push up prize money too high.

It also seems horribly similar to the corporate world, where CEO pay is many multiples of average workers. The winner earns eight times a losing quarter-finalist. I see the logic in halving the money as you go down the field, but a quarter-finalist has won four matches, compared to the winner’s seven – more than half the entertainment and effort for 1/8th of the money.

Is this fair? No. Would the winner be happy with a fraction of the winnings? Yes, I’m sure. So why don’t we change? Why isn’t the money more evenly spread around. It would be interesting to see which players kicked up a fuss.

But then again, I’m quietly chuffed with my £50 winnings. It’s funny what a little money can do.
The Wimbledon roof myth

There’s been quite a lot of rain already at Wimbledon this year, and that new roof has been wheeled out a few times. Which is great – for TV, and the 15,000 Centre Court spectators.

However, I keep hearing the people say that the tennis is “sorted out” and the roof will keep things on track so there aren’t delays.

Not really. It all depends when it rains. There are 13 days to Wimbledon, with an exponentially decreasing number of matches to be played. The men and women singles are both a field of 128 – which means you need 127 matches to work out the winner for each event. Centre Court can host two men’s matches a day – three if they started very early (between 9 and 15 total sets), and four women’s matches (8 to 12 sets).

So – here’s the tournament plan, the matches required, and whether the roof keeps the whole thing on schedule.

Weekday Day Round Total matches required Will a roof keep the tournament on schedule?
Mon 1 1st round, m&w 64 No
Tues 2 1st round, m&w 64 No
Weds 3 2nd round, m&w 32 No
Ths 4 2nd round, m&w 32 No
Fri 5 3rd round, m&w 16 No
Sat 6 3rd round, m&w 16 No
Mon 7 4th round, m&w 16 No
Tues 8 women qtr 4 Maybe
Weds 9 men qtr 4 Almost certainly not
Ths 10 women semi 2 Yes
Fri 11 men semi 2 Yes
Sat 12 women final 1 Yes
Sun 13 men final 1 Yes

Answer: the roof is great for the last four days, and maybe the second Tuesday. Anything on days one to seven and it’s all about show. The TV audience is happy; the centre court crowd (which is less than half the gate during the first week) is happy; but not the players or the organisers. Or the people with tickets to court one or ground passes.

The lazy journalism of citing Facebook and Twitter

I’m getting very annoyed with the phrase “such as…” in journalism. It’s becoming a lazy substitute for not having concrete facts, and is used especially to write about websites and  social networks where the writer usually has no idea what they are talking about.

In other words, the phrase “such as Facebook and Twitter” really means “something’s going on online and it must be going on on Facebook and Twitter so just say that as that’s the only new thingy we’ve heard of in the newsroom”.

Some examples:

From the Telegraph: “Teachers believe social networking sites such as Facebook and Twitter are to blame for pupils’ poor grades, a study has concluded.”

From the FT (see, I’m not biased): “Banks are searching out fresh ways to engage with customers on social networking sites such as Facebook and Twitter as they look to capitalise on the growing popularity of these mediums…”

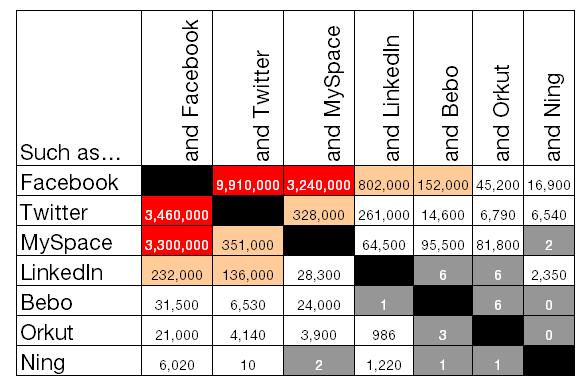
I thought the other day – if I had a pound for every time I saw that written… So I googled it. Over 9 million instances of that exact phrase. And then I got curious. What about the other combinations. LinkedIn and, say, Orkut? Why should Facebook and Twitter be the only show in town?

So here’s the grid:

Source: Google results for exact phrase “such as x and y”. Here’s the data.

I’ve given anything over a million a red background, 100,000 – 1m in yellow, under 100,000 white, and put grey on anything less than 10.

So Facebook and Twitter is the killer combo, although MySpace does well with Facebook. But look at the rest – it’s a joke. It’s not as if they have that magnitude of users less than Twitter – or even Facebook.

But the real joke is that Twitter and Facebook are so radically different. To lump them together that often in a lazy format is ridiculous. The network effect of journalists is not far removed from the network effect of social networks, or software, or other monopolistic services. Once everyone starts to say “such as Facebook and Twitter”, there isn’t much point in bucking the trend.


The limits of sports stats: the example of Nadal and the WSJ

This year in tennis is been all Djokovic and that winning streak. The narrative of sports is always about who is “the Man”, so therefore, Rafael Nadal must be a spent force.

The Wall St Journal have, they think, proved it. In their piece Nadal Looks Surprisingly Human in Paris they look at the stats of Nadal’s first four matches this year, and compare to the years he has won before.

Nadal’s stats don’t reflect a full-blown disaster. But compared to his first four victories in the years he won here, Nadal is spending on average a half hour longer on court and breaking opponents’ serves far less often. All this despite not playing a single seeded opponent so far.

What’s wrong with this? First off, players who are seeded CAN’T meet another seed until the third round anyway, so that’s hardly stunning. Let’s look a bit more at the stats they cite.

Serve Game WIN% RETURN GAME WIN% GAMES WIN% SET
WIN%
AVG. MATCH LENGTH
2011 85.5% 39.7% 62.8% 85.7% 2:52
2010 85.2% 50.9% 68.2% 100% 2:18
2008 87.8% 65.2% 76.8% 100% 2:05
2007 86.8% 50.9% 68.9% 100% 2:14
2006 81.8% 43.9% 62.9% 85.7% 3:04
2005 87.7% 44.6% 66.4% 92.3% 2:09

Sources: ATP World Tour, Stats Inc.

His average match length is high, but it was higher in 2006 when he won the title – hardly shocking. The only 2011 stat quoted which is worst in the list is the percentage of return games won – 4 per cent lower than the next lowest. Four per cent, which works out at about 2.5 games on the opponent’s serve that he hasn’t won in 4 rounds – less than a break of serve less per match.

So we have boiled Nadal’s struggle down to about a break less per match from 2006, perhaps two per match from his peak, plus a bit more time on court.

It’s hardly evidence of decline. But stats are like that. They don’t always show what seems evident to watchers and commentators. They don’t show the workrate, the struggle on points, the extra deuces, the attitude. Perhaps those things are there, perhaps we’re seeing what we want to see to fit the narrative. Let’s see what happens from here to the final.

The FA cup: magic and economics

There are three things always said about the FA Cup. It’s the world’s oldest cup competition; it has a magic to it; and it isn’t what it once was. But few people actually manage to quantify how or why the cup’s importance is in decline.

The Guardian’s secret footballer promised to do so, citing Freakonomics as an inspiration, but then trotted non-economic analysis such as how the timing of the final (amongst normal Premiership games) and other factors such as Manchester United pulling out for the World Team Cup in 2002 had undermined it. There’s also the argument that the prestige of playing at Wembley is devalued by holding Cup semis there.

All true, but not really the point. Then, tucked away towards the end of the piece, the Secret Footballer hit the nail on the head:

Stoke City or Manchester City will pick up £1.8m for winning the FA Cup, which is the difference between finishing 15th and 17th in the Premier League.

And then in the next paragraph: “£30m is on offer to reach the Champions League [for finishing in the top four]”.

It’s a trophy, but not one financially worth winning if you take your eye off Europe or the league.

In a world where football is ALL about money, that tells you everything you need to know.

Tennis: A rivalry in decline

Lost in all the battle of the streaks – Nadal on clay vs Djokovic in 2011 – was the fact that Nadal and Federer met again in a semi final on Saturday.

It’s a bit of a comedown for the greatest rivalry * in modern tennis. Nadal and Federer have played two semis in a row now, after previously playing in eight finals straight. Overall, of their 24 meetings, 18 have been in finals.

This is going to happen more now that Djokovic is number 2, and closing in on the top spot. At every big event there is a good chance they will be in the same half of the draw.

While nothing lasts forever in sport, I do still hope they play another big final this year. Strangely, it’s been over two years now that they met in a slam. The last meeting was the Aussie Open of 2009, which was a great match.

* greatest rivalry = based on the seven slam finals contested, two more than the next rivalries of Sampras-Aggasi and Lendl-Wilander; and on the time at number 1 and 2 together in the rankings (most of the last six years).

Where is the Marathon’s Usain Bolt?

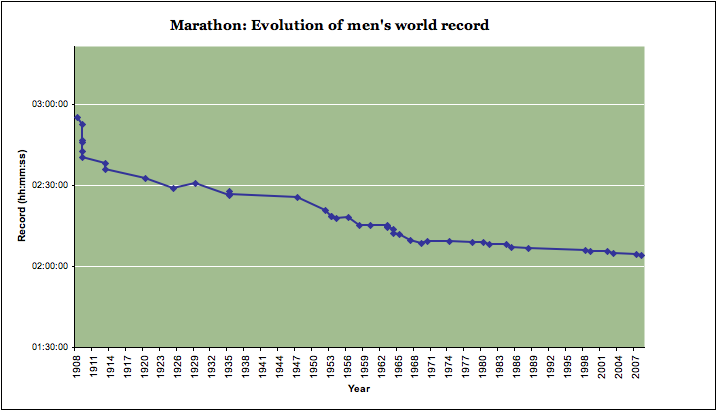
Today is the London Marathon. Aside from the amazing efforts of people to raise money for charity, and the tremendous physical effort to complete the course, we are unlikely to see a world record today. Why? With all the improvements in diet, technology and sports science, why aren’t we running sub-2 hour marathons?

This is a question the BBC tried to answer recently, and they did quite a good job, looking at the kinds of issues and conditions marathon runners face.

The marathon record progression is starting to look like a classic long-tail chart. Here it is:

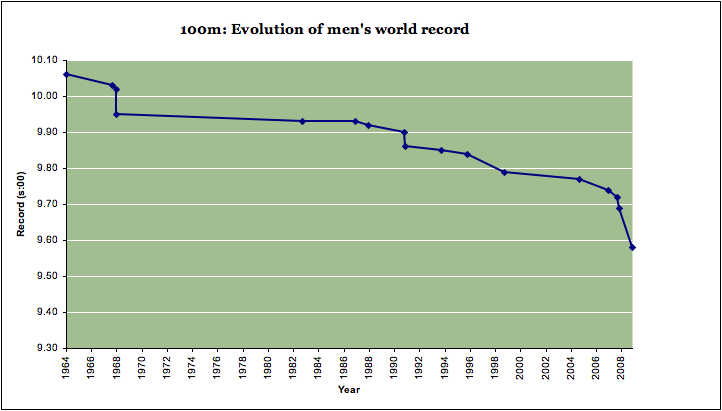
One thing they could have done was compare it to the men’s 100m, which was also looking like it had stalled, until Usain Bolt came along:

So could someone do to the marathon what Usain Bolt did to the 100m record?

Given that the marathon IS so long, you would think there was more room for cutting swathes of time off the record, and that the 100m would be the small, incremental progression – and yet it hasn’t happened like that.

Perhaps this is because the optimal physical build of the marathon runner has been worked out for a long time now, whereas Bolt flew in the face of 100m conventional wisdom with his physique. You aren’t going to get a complete turnaround in marathon runners, as the distance is too long.

So have we reached the end of marathon records? Will 2 hours ever be beaten? I think it will, but not in 20 years as the BBC article suggested, but either very soon or not for 50 years. Records rarely stick to the charts.

The internet of 1901

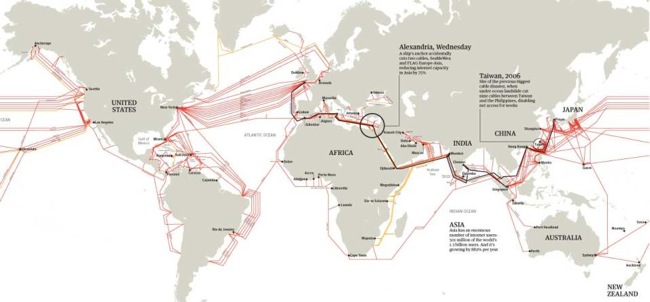
There was a curious story today of a woman who cut off an entire country’s internet access. A Georgian woman digging in her garden cut off Armenia from the net.

Impressive in a way, but it also got me thinking about the internet, and how, despite all the talk of the cloud and cyberspace, the internet is a very real thing of servers and fibre optic cables.

In fact, the cabling around the world is very mappable – the Guardian did this great infographic after a previous cut-off in Egypt. And then I saw a picture of telegraph cables from 1901. See any similarity?

« Older posts Newer posts »

© 2025 Rob Minto

Theme by Anders NorenUp ↑