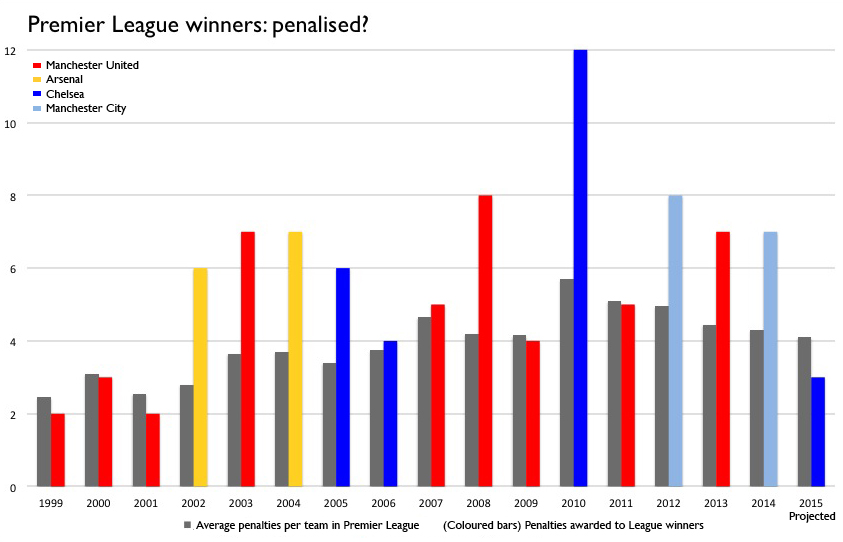
 Chelsea took the unusual step of publishing an official moan about their lack of penalties this season. It has been widely reported (Guardian, BBC), but without anyone really taking them to task on the data. But a little statistical digging might have shown that they have nothing to complain about.
The Chelsea article said:
It is in our 28 Premier League games this season where we have been awarded just two penalties. Both were for infringements on the league’s most-fouled player, Eden Hazard, and both were in home London derbies, against Arsenal and QPR respectively. The most recent was four-and-a-half months ago.
Historically, this figure seems abnormally low.
In the Double-winning 2009/10 campaign, when we were the country’s outstanding attacking team, we were awarded 12 league penalties.
So let’s look at the evidence. The numbers that Chelsea point to only look at their own penalties awarded. Statistically, it’s known as sampling bias, but you don’t need to know that to see that it is a bunch of numbers out of context.
What we really care about is a few things: how many penalties should a team expect over a season? Are better teams given more penalties? And how do the league winners compare? The only way to know this is to (with apologies to Peter Moores) look at the data.
Chelsea did indeed get 12 penalties in 2009-10. But this is an outlier – in fact, for all the penalties data I could get from the 1998-99 season onwards, it is the highest number given to one team in a single season.
Two other teams have also been awarded 12 penalties in one campaign. Can you guess which teams they are? Have a go. Other league winners? Nope. In fact, it was Liverpool, in 2013-14 when they finished second; and Crystal Palace, in 2004-05, finishing in 18th place!
That might give a clue as to whether league position and penalties are connected. Basically, they are not. They are very weakly correlated, by a score of -0.28. *
Over a season, the average penalties per team per season has varied between two and six. And in the 16 years of available data, the Premier League winners have had a lower penalty count than the average team five times. That leaves 11 times when it has been higher (see chart below). Yes, you would expect the league winners to play attacking football and get a more penalties than the league average, as Chelsea suggest – but for Chelsea to get less than the average this season is hardly unprecedented.
Put another way: only four times in the sixteen years of data have the team winning the league also been awarded the most penalties (Arsenal 2001-02, Manchester United 2002-03, 2007-08 and Chelsea 2009-10). Penalties are not some divine right of the best team. History shows that a team can be given a lot of penalties and still finish low down the league. Just ask Palace. Or Sunderland (6 penalties, 14th place last year). Or Blackpool (8 penalties, 19th place in 2010-11). Or West Ham (9 penalties, 17th place in 2009-10).
In other words: Chelsea’s current lack of penalties is nothing strange. It’s just… football.
* A negative number should be expected here, as a better league position is a lower number. For penalties and league position to be correlated, a score closer to -1 would be needed. For those wondering, it is very weakly positively correlated to the points a team gets over a season, with a score of 0.32.


