Sport is inherently unequal. Talent and skills are not distributed fairly, and it would be a far more boring world if they were.
But when it comes to the wages that are paid to players, some leagues prefer a fairer system – especially in the US – and some are content with a less equal system. Some are downright ridiculous.
The data provided each year by Sporting Intelligence highlights the haves and have-nots by comparing average team wages in 333 teams across many major leagues. As ever, the American sports leagues are notable by their evenness. In the NFL, for example, the top paying team, the Miami Dolphins, pay an average annual salary of £1.37m per player. The lowest payers are the New York Jets, with £1.01m per player. That’s across 32 teams. The difference top to bottom is just £357,000.
Let’s look at some of the major European football leagues by way of comparison. The contrast and variation is astonishing.
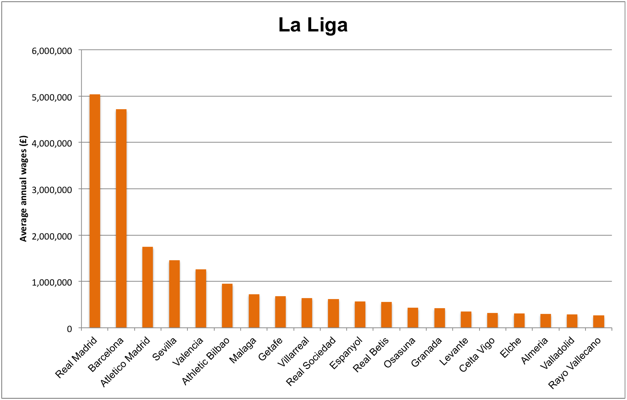
The biggest gap is the French Ligue 1. The top club, Paris Saint Germain (now the highest wage paying club in the world), pay £5.2m per year per player. That’s £5m more than the average player at the bottom club, Guingamp. It’s a similar picture in Spain, where Real Madrid pay an average salary of £5.0m per year, which is £4.8m more than the bottom club, Rayo Vallecano.
The English Premier League is almost egalitarian in comparison, with the £5m wages paid by Manchester City just £4m higher than the £998,000 paid by Crystal Palace.
The worst league for inequality is in fact the Scottish Premier League – just 12 clubs, but Celtic (average salary £900,000) pay their players 25 times that of the bottom club, Ross County (average salary £36,000).
Ranking the leagues by Gini coefficient shows the differences. A score of 1 is perfect inequality, whereas 0 is perfect equality. The SPL scores over 0.5, as do La Liga in Spain and Ligue 1 of France. That’s not good. Some US leagues are below 0.1.
| League (teams) | Gini coefficient | Highest wages (£ pa) | Lowest wages (£ pa) | Difference (£) | Multiple |
| Scottish Premier League (12) | 0.527 | 901,943 | 36,000 | 865,943 | 25.1 |
| La Liga (20) | 0.513 | 5,040,520 | 264,972 | 4,775,548 | 19.0 |
| Ligue 1 (20) | 0.507 | 5,298,693 | 263,331 | 5,035,362 | 20.1 |
| CSL (China Super League) (16) | 0.399 | 647,237 | 55,335 | 591,902 | 11.7 |
| Serie A (20) | 0.395 | 2,859,195 | 303,968 | 2,555,227 | 9.4 |
| Bundesliga (18) | 0.331 | 4,468,643 | 478,783 | 3,989,860 | 9.3 |
| Major Soccer League (20) | 0.315 | 519,898 | 81,602 | 438,296 | 6.4 |
| English Premier League (20) | 0.293 | 5,015,122 | 998,632 | 4,016,490 | 5.0 |
| J-League (18) | 0.209 | 246,388 | 52,595 | 193,793 | 4.7 |
| MLB (30) | 0.183 | 4,679,937 | 1,344,448 | 3,335,489 | 3.5 |
| Nippon Pro Baseball (12) | 0.144 | 644,491 | 266,561 | 377,930 | 2.4 |
| NBA (30) | 0.086 | 3,645,286 | 1,286,661 | 2,358,625 | 2.8 |
| National Hockey League (30) | 0.070 | 1,946,903 | 1,187,217 | 759,686 | 1.6 |
| NFL (32) | 0.043 | 1,368,255 | 1,011,208 | 357,047 | 1.4 |
| Canadian Football League (9) | 0.038 | 67,026 | 54,753 | 12,273 | 1.2 |
| Australian Foorball League (18) | 0.027 | 157,888 | 125,389 | 32,499 | 1.3 |
| IPL (8) | 0.020 | 2,626,933 | 2,356,386 | 270,547 | 1.1 |
The top-to-bottom difference is one thing, but the difference in wages can also be stark at the top too. After Real Madrid and Barcelona in Spain, there is a £2.9m per year drop to the next best paying team, Atletico Madrid. PSG of France pay players nearly three times more than the second team, Monaco. And German heavyweights Bayern Munich pay nearly £2m, or 1.8 times the next richest team in their league, Schalke.
England and Italy have leagues that are fairer in comparison, although both have more of a five or six team exclusive group, with a drop in wages after that.
Note that China’s Super League has a greater wages disparity than the English, German or Italian top leagues. And the US Major League Soccer has a worse Gini score and top-to-bottom gap than England. The EPL gets a bad press for unfairness, but it’s not that bad.
Whereas the relaxation of the Financial Fair play rules by UEFA looks pretty poorly timed, to say the least.