The best of the last week (or so). Fifa, Barca, failure, and a long hour. Continue reading
Page 12 of 39

Everyone agrees that Fifa needs to change. But what about the tricky question of members’ votes? In general, the argument seems to go like this: Continue reading
FIFA
So much has been written about Fifa in the past week, it’s worth remembering that most of the allegations of corruption are old old news. Still… Continue reading
TENNIS
Is this Novak Djokovic’s French Open? Whether it’s Rafael Nadal’s atrocious form, or Djokovic’s incredibly detailed preparation, it looks that way.
FOOTBALL
You might hate Sepp Blatter, but he understands the world better than you, you irrelevant Westerner. Meanwhile, Qatar’s World Cup death rate is now over 60 per match, and Brazil’s 2014 legacy is already a mess.
English clubs need to learn to love the Europa League. The country may soon lose a Champion’s League place. Continue reading
 Sport is inherently unequal. Talent and skills are not distributed fairly, and it would be a far more boring world if they were.
But when it comes to the wages that are paid to players, some leagues prefer a fairer system – especially in the US – and some are content with a less equal system. Some are downright ridiculous.
The data provided each year by Sporting Intelligence highlights the haves and have-nots by comparing average team wages in 333 teams across many major leagues. As ever, the American sports leagues are notable by their evenness. In the NFL, for example, the top paying team, the Miami Dolphins, pay an average annual salary of £1.37m per player. The lowest payers are the New York Jets, with £1.01m per player. That’s across 32 teams. The difference top to bottom is just £357,000.
Let’s look at some of the major European football leagues by way of comparison. The contrast and variation is astonishing. Continue reading
10 reasons why Barcelona won La Liga. You might think 1 to 9 are ‘Messi’, but there’s a lot more than that going on at the Nou Camp.
The beauty of Roger Federer’s tennis can cure relationships. And you thought you were a big Federer fan. Julian Barnes reviews the very strange Federer and Me by William Skidelsky. Continue reading
I have decided to share a weekly wrap of interesting sports writing as an email newsletter.
It won’t have match reports or updates. Instead, it will be a collection of longer pieces, analysis, data-driven journalism and other quirky pieces, from around the web, across a variety of sports.
Any ideas, let me know – newsletter@minto.net
I hope to send it out every Tuesday. The sign up page is in the menu above, and below:
[yks-mailchimp-list id=”e1fd6a4045″ submit_text=”Subscribe”]

Update (May 15): Adam Lyth has now been called into the England Test squad and will probably make his debut against New Zealand.
—–
When a player hits 300-plus for their county, it’s hard not to take notice. But should Kevin Pietersen’s massive innings for Surrey get him back in the team?
He thinks so. He said afterwards:
“All I’ve been asked to do by the chairman-elect is to get a county and get runs,” said Pietersen.
“I’ve got runs, I’ve got a county and I do believe I’m good enough to play for England.
“All I can do is score runs, that’s it.
KP has been misguided and is confused, and here’s why.
This is nothing to do with that book (the one that trashed the ECB, former and current coaches and captains). It is quite simply that one innings isn’t enough.
If it was, then here are a list of people who would have been picked for England in the last 5 years:
Alex Gidman
Alex Lees
James Hildreth
Andrew Gale
Adam Lyth
All of the above players have hit 250-plus in county cricket. None have been picked for England’s senior Test side.
But if you look at the players who have scored the highest total runs in a county season, or had the highest average over a season (excluding overseas players and retired England players), there is a better chance of picked for the Test side. Adam Lyth would seem to have a better claim for a Test place then KP.
| Highest averages | |||||||||
| Year | Player | Mat | Inns | NO | Runs | Ave | 100 | 50 | Notes |
| 2014 | Adam Lyth | 17 | 24 | 1 | 1,619 | 70.39 | 7 | 6 | No England place |
| 2013 | Gary Ballance | 15 | 22 | 1 | 1,363 | 64.9 | 6 | 6 | Test debut Jan 2014 |
| 2012 | Nick Compton | 14 | 21 | 6 | 1,494 | 99.6 | 5 | 7 | Test debut Nov 2012 |
| 2011 | Nick Compton | 14 | 23 | 4 | 1,098 | 57.78 | 2 | 6 | See above |
| 2010 | James Hildreth | 16 | 23 | 1 | 1,440 | 65.45 | 7 | 5 | No England place |
| Most runs | |||||||||
| Year | Player | Mat | Inns | NO | Runs | Ave | 100 | 50 | Notes |
| 2014 | Adam Lyth | 17 | 24 | 1 | 1,619 | 70.39 | 7 | 6 | No England place |
| 2013 | Moeen Ali | 17 | 29 | 5 | 1,420 | 59.16 | 4 | 8 | Test debut June 2014 |
| 2012 | Nick Compton | 14 | 21 | 6 | 1,494 | 99.6 | 5 | 7 | Test debut Nov 2012 |
| 2011 | James Taylor | 17 | 32 | 3 | 1,602 | 55.24 | 3 | 10 | Test debut Aug 2012 |
| 2010 | Adam Lyth | 16 | 29 | 0 | 1,509 | 52.03 | 3 | 9 | No England place |
(In 2011 Marcus Trescothick was the leading run scorer and had the highest average in county cricket, but had retired from the England team. In 2010 the most runs were scored by Mark Ramprakash – again, retired from the England team.)
| Highest innings in season | |||||
| Year | Player | Runs | Team | Match Date | Notes |
| 2014 | Alex Gidman | 264 | Gloucs | 09-Sep-14 | No England place |
| 2013 | Alex Lees | 275* | Yorkshire | 17-Jul-13 | No England place |
| 2012 | James Hildreth | 268 | Somerset | 31-Mar-12 | No England place |
| 2011 | Michael Carberry | 300* | Hampshire | 02-Aug-11 | Test debut Mar 2010 (1 test), recalled Nov 2013, more than 2 years later |
| 2010 | James Taylor | 206* | Leics | 29-May-10 | Test debut Aug 2012 (after 2011 season, see above) |
The selectors have been very clear in their methods – they reward consistency, not single innings. As it turns out, a recall isn’t going to happen, however many runs KP scores. Colin Graves (incoming ECB chairman) said the wrong thing (about KP having any recall chance), which was then taken the wrong way (regarding single innings).
But the KP recall bandwagon will get mightily awkward if he does keep getting runs and topping the average charts. Until he retires completely from the game, there will always be a question mark over Pietersen’s England inclusion.
(Data from ESPN Cricinfo)
 Amid all the articles congratulating James Anderson for surpassing Ian Botham as England’s all-time Test wicket taker, I’ve not seen one to put the numbers in perspective. It’s a fine achievement, certainly, but compared to other countries, it’s pretty small beer.
Just like the centuries record that three years ago fell to Alastair Cook, the England Test wickets record was abnormally low.
For starters, England still is the only major Test nation (bar Zimbabwe and Bangladesh) to have its leading all-time Test wickets record below 400.
Put another way, if Anderson was from India or South Africa, he would be just 4th on that country’s list of all-time wicket-takers. His mark of 384 would put him third in Australia and the West Indies too.
Essentially, Botham’s record has been there for the taking for a long time. England play a lot of Test cricket, so there’s no excuse in terms of matches played. There just hasn’t been a bowler of the class and longevity required to take the record.
Botham was top of the whole world for a while, with a test record that stood for a couple of years. But then the record was pushed up over 400 by two other all rounders, Richard Hadlee and Kapil Dev; and and then 500 by Courtney Walsh.
Subsequently, the two spinners Shane Warne and Muttiah Muralitharan took the record out of sight, over 600, then 700, with Murali on exactly 800 at the end of his career. The all-time list is below the break.
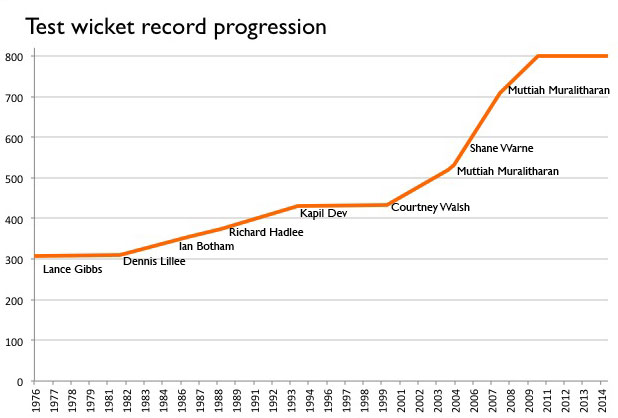
Anderson is a fine bowler, but I would be surprised if he gets over 500 wickets when he’s finished. He may well end up around 6th on the all time list if he can stay healthy and get to 450+ wickets. But Dale Steyn of South Africa is ahead of him already, despite playing 22 fewer tests. (A bit old now, but a superb Steyn-Anderson comparison is here that shows how far superior Steyn really is.)
England have not had a world-class consistent bowling attack for a generation. When the team has done well, the bowlers have flourished, but have then faded – such as Steve Harmison and Simon Jones, who had the potential to become a combination as good as any. Great test teams have needed bowlers who work as a unit, and stick around. Anderson has too often carried the attack alone, and while he has earned the record, it is a figure born of hard work and persistence, rather than from blowing teams away.

The Boat Race is a bizarre event in many ways. The course is incredibly winding and gives a potentially huge advantage to the crew on the Surrey station (the south side). It’s elitist. The participants are typically now international rowers rather than amateur undergraduates. It’s way longer (over 4 miles) than usual rowing races (2k).
But there are two other odd things going on.
1) The race is getting slower
For many years, as boat technology improved and crews trained harder and smarter, and the rowers became international pros, the winning time came down. From the 1950s to 2000, typical times went from around 20 minutes to 17. The course record was set in 1998, at 16:19 by Cambridge. From 1996 to 2005, 5 of the 10 winning times were sub-17 seconds.
But since 2005, there have been none below the 17 second mark. As the chart below of the rolling 10-year average shows, since 1999 the times are getting slower. (I’ve used the 10-year average to smooth out what is otherwise a very bumpy chart, and show the trend. The average also mitigates the impact of the bad-weather years.)
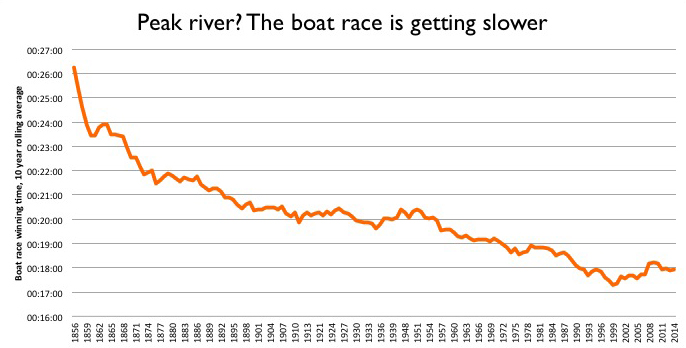
Why the drop in pace? It’s hard to say for sure. My guess is that technological and fitness improvements are now very incremental. The shift to a global talent pool happened a while back. Instead, the races are tight, with clashing oars and cat-and-mouse tactics. It’s all about winning, not the clock.
This leads to the second odd thing:
2) The reserve crews are frequently quicker
Obviously, you would expect the Blue crew to beat the reserves (Goldie of Cambridge, Isis of Oxford). But some years the reserves, who race just before the Blues, are quicker. In fact, in seven of the last 18 years, the reserve crews have registered a faster time. The average gap between the winning times is also narrowing.

This suggests that there is a deeper pool of talent available to both teams. But it also backs up the idea that the Blue race is all about winning.
Follow
RSS
 Site feed: use this to add to Google reader or any other RSS reader.